


ArcVera produces Wind and Solar Resource Anomaly Maps every month to assist stakeholders in their quest for answers to explain out-of-range power production outcomes.
Anomaly maps are created using a combination of reanalysis and operational weather data and presented in the context of a 40-year historical climate.
ArcVera’s unique combination of data sources enables it to quickly provide an accurate image of the wind or solar resource in the form of maps for a particular period of time.
These timely maps provide essential information for project stakeholders who are in charge of monthly project production reports, operations, and reporting to investors and owners when output falls short or exceeds predictions.
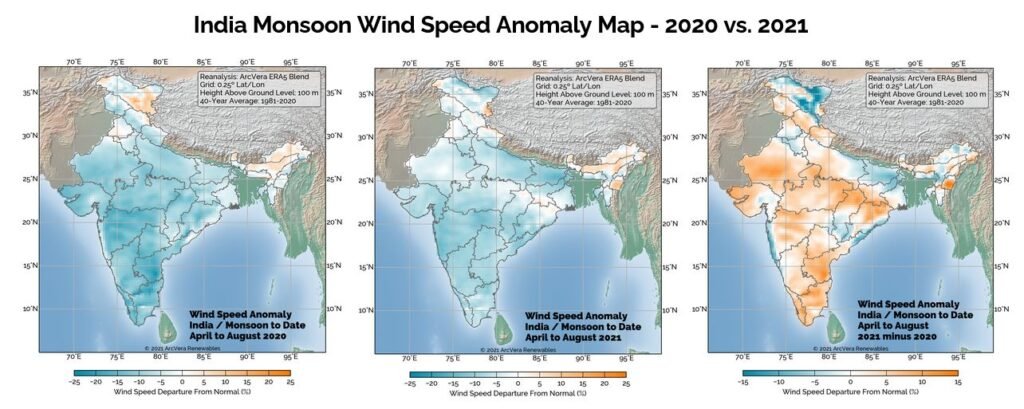
ArcVera states and illustrates, using comparable wind resource anomaly maps, that the wind anomaly across most of India from April to September 2021 was 5-10% below normal, but it was 10-20% below normal during the same time in 2020. Of course, 2020 featured the historically low wind month of July, which was the least windy July in the ERA5 Reanalysis’s 43-year record.

The monsoon season in 2021 has been more steady and higher than in 2020, but still relatively low month to month, as opposed to being dominated by one severely low month as in 2020.
These anomaly maps are only the beginning of assisting India’s project owners and operators in conducting a first-person examination of the impact of resource fluctuations on the electricity production of their wind and solar assets.
The scientists at ArcVera use modern atmospheric science methodologies to explain the interannual variable anomalies of India’s wind energy resource.
This is a PR News Wire Feed; edited by Clean-Future Team